from folium import Map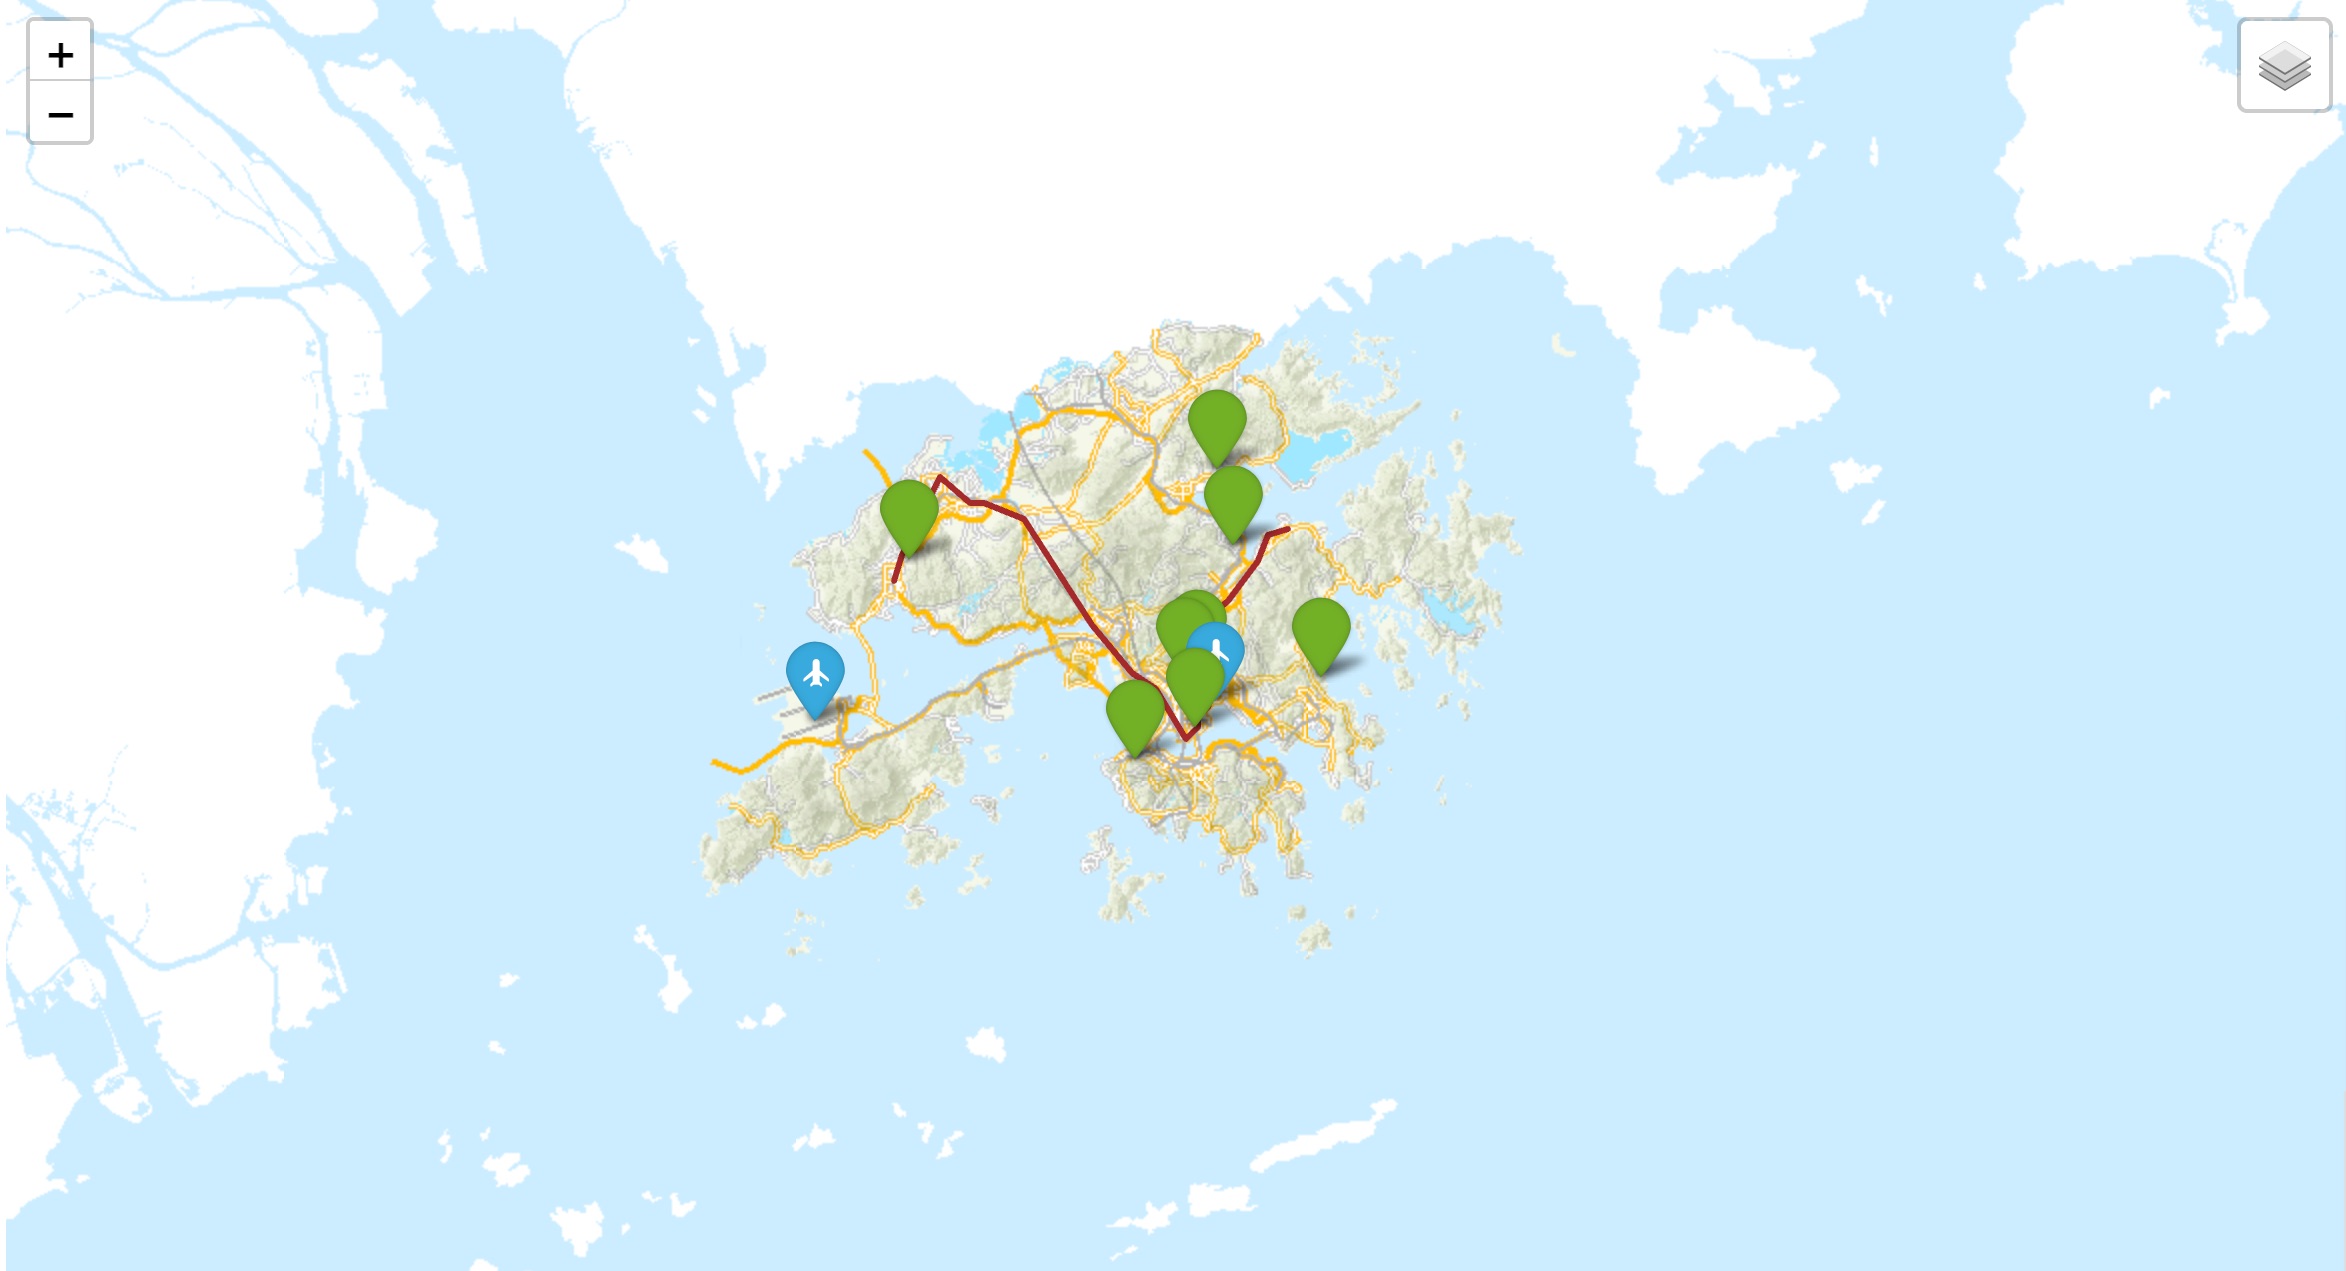
In this post, I demonstrate how to get started mapping in Python with Folium, a Python wrapper over Leaflet which uses JavaScript.
I must say, Folium is quite pleasant to use especially for one with no mapping background. You can view the official getting started guide here.
The Map Object
The Map object is the starting point.
m = Map(); mMake this Notebook Trusted to load map: File -> Trust Notebook
By default, Folium uses OpenStreetMap which you can see in the bottom right corner. I’ll enter the latitude and longitude of Hong Kong.
HK = (22.3193, 114.1694)
Map(HK)
Make this Notebook Trusted to load map: File -> Trust Notebook
Maps are rendered using tilesets. Tilesets contain tiles. Tiles are regular .png image files. Maps are formed by piecing these tiles together. OpenStreetMap is one tileset.
Tilesets
Map(HK, tiles='cartodb positron')/app/data/.local/lib/python3.12/site-packages/folium/raster_layers.py:130: UserWarning: CartoDB tiles now require an API key. Please provide one to continue using the tiles. You can request the key at https://carto.com/basemaps/apikey/.
tiles = tiles.build_url(fill_subdomain=False, scale_factor="{r}") # type: ignoreMake this Notebook Trusted to load map: File -> Trust Notebook
Here, I’ve requested a tileset which requires an API key. While I have not supplied one, this example allows us to see the tile like nature of maps.
Hong Kong’s CSDI Portal comes with its own tileset of Hong Kong. I’ll load that in.
url = 'https://mapapi.geodata.gov.hk/gs/api/v1.0.0/xyz/basemap/wgs84/{z}/{x}/{y}.png'
Map(HK, tiles=url, attr='Map from Lands Department')
Make this Notebook Trusted to load map: File -> Trust Notebook
The scale for which the tileset is applicable should be taken note of. The the scale is too small, only gray tiles are visible. This is because tiles do not exist for that scale.
Map(HK, tiles=url, zoom_start=2, attr='Map from Lands Department')Make this Notebook Trusted to load map: File -> Trust Notebook
Scale aside, if a latitude or longitude is set for which tiles do not exist, gray tiles will still be seen. For this particular Hong Kong tileset, no tiles exist outside the Hong Kong region.
Even if we leave the zoom attribute, if we are not at the correct latitude or longitude, we wil still see grey map tiles because no tilesets exist outside the Hong Kong region for this specific tileset.
Map(tiles=url, attr='Map from Lands Department')Make this Notebook Trusted to load map: File -> Trust Notebook
I’ll now load another tileset from the CSDI portal. This one works for regions outside Hong Kong. You can try pan around and now gray tiles will be returned.
Map(HK, tiles='https://mapapi.geodata.gov.hk/gs/api/v1.0.0/xyz/imagery/wgs84/{z}/{x}/{y}.png', attr='Map from Lands Department')Make this Notebook Trusted to load map: File -> Trust Notebook
Every scale or pan sends a request to the server at the specified URL, fetching the new relevant tiles as needed.
Note that the URL has the {z}/{x}/{y} parameters. z defines the the scale, and x and y define the pan. If we hardcode these parameters, we can more clearly see the tile effect in play.
Map(HK, tiles='https://mapapi.geodata.gov.hk/gs/api/v1.0.0/xyz/imagery/wgs84/17/107104/57177.png', attr='Map from Lands Department')Make this Notebook Trusted to load map: File -> Trust Notebook
As z, x, and y have been hardcoded, every action will result in a tile corresponding to z=17, x=107104, y=57177 being returned.
Markers
I’ll add some markers to the map.
m = Map(HK, tiles=url, attr='Map from Lands Department'); mMake this Notebook Trusted to load map: File -> Trust Notebook
from folium import MarkerI’ll add a marker pointing out where Hong Kong’s former Kai Tak Airport.
from folium import IconKAI_TAK_AIRPORT = (22.3208,114.1927)
Marker(
location=KAI_TAK_AIRPORT,
tooltip='Click me!', popup='This is Kai Tak Airport, which operated from 1925 to 1998.',
icon=Icon(color='gray', icon_color='white', icon='plane')
).add_to(m)
mMake this Notebook Trusted to load map: File -> Trust Notebook
And another marker pointing out Hong Kong’s current Chek Lap Kok Airport.
CHEK_LAP_KOK = (22.3080,113.9185)
Marker(
    location=CHEK_LAP_KOK,
    tooltip='Click me!', popup='Chek Lap Kok Airport began operation in 1998.',
    icon=Icon(color='gray', icon_color='white', icon='plane')
).add_to(m)
m
Make this Notebook Trusted to load map: File -> Trust Notebook
Markers can be organized into a group. This group can then act as a layer on the map that can be toggled.
Feature Groups & Layers
With Folio, it’s simpler to create a new map rather than delete existing markers.
@delegates(Map)
def make_map(location=HK, tiles='https://mapapi.geodata.gov.hk/gs/api/v1.0.0/xyz/basemap/wgs84/{z}/{x}/{y}.png', attr='Map from Lands Department', **kwargs): return Map(location=location, tiles=tiles, attr=attr, **kwargs)
m = make_map(); m
Make this Notebook Trusted to load map: File -> Trust Notebook
from folium import FeatureGroupgroup_1 = FeatureGroup('Airports').add_to(m)
airports = [(KAI_TAK_AIRPORT, 'Kai Tak Airport'), (CHEK_LAP_KOK, 'Chek Lap Kok Airport')]
for a in airports: Marker(a[0], tooltip=a[1], icon=Icon(color='blue', icon_color='white', icon='plane')).add_to(group_1)from folium import LayerControlLayerControl().add_to(m)
mMake this Notebook Trusted to load map: File -> Trust Notebook
The airport markers can now be toggled.
I’ll add another layer containing the marker for Hong Kong’s 8 main universities. However, a new map will need to be created for this as LayerControl needs to be added last.
m._childrenOrderedDict([('https://mapapi.geodata.gov.hk/gs/api/v1.0.0/xyz/basemap/wgs84/{z}/{x}/{y}.png',
<folium.raster_layers.TileLayer at 0x7ba1ad63a6f0>),
('feature_group_3e034b7cbee33cb617ad4123bae7019c',
<folium.map.FeatureGroup at 0x7ba1ad63aed0>),
('layer_control_53cfe92c265589d8423b907aa2be0322',
<folium.map.LayerControl at 0x7ba1ad7b7b00>)])m = make_map()
group_1 = FeatureGroup('Airports').add_to(m)
airports = [(KAI_TAK_AIRPORT, 'Kai Tak Airport'), (CHEK_LAP_KOK, 'Chek Lap Kok Airport')]
for a in airports: Marker(a[0], tooltip=a[1], icon=Icon(color='blue', icon_color='white', icon='plane')).add_to(group_1)
group_2 = FeatureGroup('Universities').add_to(m)
unis = [
((22.28425, 114.13810), "HKU"),
((22.41951, 114.20516), "CUHK"),
((22.33670, 114.26600), "HKUST"),
((22.33609, 114.17333), "CityU"),
((22.30449, 114.18008), "PolyU"),
((22.46778, 114.19400), "EdUHK"),
((22.34075, 114.18026), "HKBU"),
((22.41057, 113.98296), "LU")
]
for u in unis: Marker(u[0], tooltip=u[1], icon=Icon(color='green', icon_color='white', icon='school')).add_to(group_2)LayerControl().add_to(m)
mMake this Notebook Trusted to load map: File -> Trust Notebook
PolyLines
A PolyLine lets us draw lines on the map. This could be useful for, say, mapping a route. I’ll map the MTR’s Tuen Ma line.
TML = [
('Tuen Mun',       22.39530, 113.97310), ('Siu Hong',       22.41200, 113.97860),
('Tin Shui Wai',   22.46140, 114.00500), ('Long Ping',      22.44560, 114.02530),
('Yuen Long',      22.44500, 114.03470), ('Kam Sheung Road',22.43470, 114.06310),
('Tsuen Wan West', 22.36830, 114.10920), ('Mei Foo',        22.33750, 114.13750),
('Nam Cheong',     22.32670, 114.15310), ('Austin',         22.30470, 114.16690),
('East Tsim Sha Tsui', 22.29530, 114.17360), ('Hung Hom',   22.30280, 114.18190),
('Ho Man Tin',     22.30940, 114.18220), ('To Kwa Wan',     22.31580, 114.18940),
('Sung Wong Toi',  22.32330, 114.19170), ('Kai Tak',        22.33040, 114.19940),
('Diamond Hill',   22.34000, 114.20140), ('Hin Keng',       22.36440, 114.17810),
('Tai Wai',        22.37280, 114.17860), ('Che Kung Temple',22.37530, 114.18610),
('Sha Tin Wai',    22.37690, 114.19420), ('City One',       22.38280, 114.20330),
('Shek Mun',       22.38780, 114.20860), ('Tai Shui Hang',  22.40890, 114.22280),
('Heng On',        22.41750, 114.22560), ('Ma On Shan',     22.42470, 114.23080),
('Wu Kai Sha',     22.42940, 114.24390),
]
route = L((lat,long) for _,lat,long in TML); route[(22.3953, 113.9731), (22.412, 113.9786), (22.4614, 114.005), (22.4456, 114.0253), (22.445, 114.0347), (22.4347, 114.0631), (22.3683, 114.1092), (22.3375, 114.1375), (22.3267, 114.1531), (22.3047, 114.1669), (22.2953, 114.1736), (22.3028, 114.1819), (22.3094, 114.1822), (22.3158, 114.1894), (22.3233, 114.1917), (22.3304, 114.1994), (22.34, 114.2014), (22.3644, 114.1781), (22.3728, 114.1786), (22.3753, 114.1861), (22.3769, 114.1942), (22.3828, 114.2033), (22.3878, 114.2086), (22.4089, 114.2228), (22.4175, 114.2256), (22.4247, 114.2308), (22.4294, 114.2439)]from folium import PolyLinePolyLine(route, tooltip='Tuen Ma Line', color='brown').add_to(m)
mMake this Notebook Trusted to load map: File -> Trust Notebook
PolyLine([(lat,lon) for _,lat,lon in TML], tooltip='Tuen Ma Line', color='brown').add_to(m)
LayerControl().add_to(m)
<folium.map.LayerControl at 0x7ba1ad437770>Plugins
Folium has a bunch of plugins. One of them is AntPath, that adds a pulsating effect to a PolyLine.
from folium.plugins import AntPathm = make_map()
AntPath(locations=route, tooltip='Tuen Ma Line', color='brown', reverse='True', dash_array=[20,30]).add_to(m)
mMake this Notebook Trusted to load map: File -> Trust Notebook
TileLayers
The map doesn’t display the names of Hong Kong’s places. For that, I’ll have to load in an additional tileset as a layer.
from folium import TileLayerTileLayer('https://mapapi.geodata.gov.hk/gs/api/v1.0.0/xyz/label/hk/en/wgs84/{z}/{x}/{y}.png', attr='Map from Lands Department', overlay=True).add_to(m)
mMake this Notebook Trusted to load map: File -> Trust Notebook
GeoJSON Data
Folium also allows for the display of GeoJSON and TopoJSON layers. These are JSON files containing data about points of interest.
Here, I load in the locations of all Hong Kong Government Primary Schools.
import requests
geojson_data = requests.get('https://portal.csdi.gov.hk/server/services/common/edb_rcd_1629267205213_74992/MapServer/WFSServer?service=WFS&version=2.0.0&request=GetFeature&typeNames=csdi:GOVT_PRS&outputFormat=GeoJSON&srsName=EPSG:4326').json()
from folium import GeoJsondef GeoJson(
data:Any, style_function:Optional=None, highlight_function:Optional=None, popup_keep_highlighted:bool=False,
name:Optional=None, overlay:bool=True, control:bool=True, show:bool=True, smooth_factor:Optional=None,
tooltip:Union=None, embed:bool=True, popup:Optional=None, zoom_on_click:bool=False,
on_each_feature:Optional=None, marker:Union=None, **kwargs:Any
):
"
Creates a GeoJson object for plotting into a Map.
Parameters
----------
data: file, dict or str.
The GeoJSON data you want to plot.
* If file, then data will be read in the file and fully
embedded in Leaflet's JavaScript.
* If dict, then data will be converted to JSON and embedded
in the JavaScript.
* If str, then data will be passed to the JavaScript as-is.
* If `__geo_interface__` is available, the `__geo_interface__`
dictionary will be serialized to JSON and
reprojected if `to_crs` is available.
style_function: function, default None
Function mapping a GeoJson Feature to a style dict.
highlight_function: function, default None
Function mapping a GeoJson Feature to a style dict for mouse events.
popup_keep_highlighted: bool, default False
Whether to keep the highlighting active while the popup is open
name : string, default None
The name of the Layer, as it will appear in LayerControls
overlay : bool, default True
Adds the layer as an optional overlay (True) or the base layer (False).
control : bool, default True
Whether the Layer will be included in LayerControls
show: bool, default True
Whether the layer will be shown on opening.
smooth_factor: float, default None
How much to simplify the polyline on each zoom level. More means
better performance and smoother look, and less means more accurate
representation. Leaflet defaults to 1.0.
tooltip: GeoJsonTooltip, Tooltip or str, default None
Display a text when hovering over the object. Can utilize the data,
see folium.GeoJsonTooltip for info on how to do that.
popup: GeoJsonPopup, optional
Show a different popup for each feature by passing a GeoJsonPopup object.
marker: Circle, CircleMarker or Marker, optional
If your data contains Point geometry, you can format the markers by passing a Circle,
CircleMarker or Marker object with your wanted options. The `style_function` and
`highlight_function` will also target the marker object you passed.
embed: bool, default True
Whether to embed the data in the html file or not. Note that disabling
embedding is only supported if you provide a file link or URL.
zoom_on_click: bool, default False
Set to True to enable zooming in on a geometry when clicking on it.
on_each_feature: JsCode, optional
Javascript code to be called on each feature.
See https://leafletjs.com/examples/geojson/
`onEachFeature` for more information.
**kwargs
Keyword arguments are passed to the geoJson object as extra options.
Examples
--------
>>> # Providing filename that shall be embedded.
>>> GeoJson("foo.json")
>>> # Providing filename that shall not be embedded.
>>> GeoJson("foo.json", embed=False)
>>> # Providing dict.
>>> GeoJson(json.load(open("foo.json")))
>>> # Providing string.
>>> GeoJson(open("foo.json").read())
>>> # Provide a style_function that color all states green but Alabama.
>>> style_function = lambda x: {
... "fillColor": (
... "#0000ff" if x["properties"]["name"] == "Alabama" else "#00ff00"
... )
... }
>>> GeoJson(geojson, style_function=style_function)
"File: ~/.local/lib/python3.12/site-packages/folium/features.py; line: 483
Type: type
GeoJson(geojson_data).add_to(m); mMake this Notebook Trusted to load map: File -> Trust Notebook
GeoPandas is a library that allows us to view GeoJSON files using Pandas.
import geopandas as gpd
gdf = gpd.GeoDataFrame.from_features(geojson_data, crs='EPSG:4326'); gdf.head(3)| geometry | GmlID | OBJECTID | Dataset | 數據集 | Facility_Name | Address | 設施名稱 | 地址 | Students_Gender | ... | 傳真號碼 | Website | 網頁 | SCHOOL_NO. | 學校編號 | Northing___坐標北 | Easting___坐標東 | Latitude___緯度 | Longitude___經度 | Last_Updated_Date___最後更新日期 | |
|---|---|---|---|---|---|---|---|---|---|---|---|---|---|---|---|---|---|---|---|---|---|
| 0 | POINT (114.10101 22.3719) | GOVT_PRS.1 | 1 | Government Primary Schools | 官立小學 | TSUEN WAN GOVERNMENT PRIMARY SCHOOL | 600 CASTLE PEAK ROAD - TSUEN WAN, AREA 2, TSUE... | 荃灣官立小學 | 荃灣青山公路 - 荃灣段六佰號 | CO-ED | ... | 24156013 | http://www.twgps.edu.hk | http://www.twgps.edu.hk | 528773000123 | 528773000123 | 825860.000000 | 828455.000000 | 22.371904 | 114.101013 | 14/9/2026 2:17:17 PM |
| 1 | POINT (114.23397 22.31526) | GOVT_PRS.2 | 2 | Government Primary Schools | 官立小學 | KWUN TONG GOVERNMENT PRIMARY SCHOOL (SAU MING ... | 130 SAU MING RD SAU MAU PING KWUN TONG KLN | 觀塘官立小學<秀明道> | 九龍官塘秀茂坪秀明道一百三十號 | CO-ED | ... | 27092660 | http://www.ktgps-smr.edu.hk | http://www.ktgps-smr.edu.hk | 572373000123 | 572373000123 | 819587.000000 | 842151.000000 | 22.315263 | 114.233973 | 29/4/2026 12:33:29 PM |
| 2 | POINT (114.23411 22.32597) | GOVT_PRS.3 | 3 | Government Primary Schools | 官立小學 | ERUDITE GOVERNMENT PRIMARY SCHOOL | 8 ON HEI STREET, SAI KUNG, NT | 安博官立小學 | 新界西貢安禧街8號 | CO-ED | ... | 23141850 | https://egps.edu.hk | https://egps.edu.hk | 510742000223 | 510742000223 | 820772.090952 | 842164.572934 | 22.325965 | 114.234109 | 31/10/2025 1:56:31 PM |
3 rows × 34 columns
The library is quite ergonomic to use.
If you have any comments, questions, suggestions, feedback, criticisms, or corrections, please do post them down in the comment section below!